
Qlik sense extension multi-series scatter plot
In my earlier post that demonstrated What if Analysis in Qlik sense, i have used Qlik sesnse’s native scatter plot to draw sine or cos […]

In my earlier post that demonstrated What if Analysis in Qlik sense, i have used Qlik sesnse’s native scatter plot to draw sine or cos […]

This blog explains how to plot two series of data in built-in XY or scatter chart of Qlik sense. Well, technically it will be a […]

Most of the leading visualization analytics products have realized that the individual needs on visualization is never ending and have made their system open to […]

This post, Qlik sense enigma js example using node js and react – Create Sheet, is part of the Qlik sense Enigma.js Example Series. This is […]

This post series is an attempt to create a simple Odoo dashboard in Qlik Sense and Power BI using Talend as an ETL tool. To […]

This post, Qlik sense enigma js example using node js and react – Create App, is part of the Qlik sense Enigma.js Example Series. This is […]
This post, Qlik sense enigma js example using node js and react – Create App, is part of the Qlik sense Enigma.js Example Series. This post […]

This Qlik sense extension – Responsive Navigation Menu is created to provide an easy navigation to the users in desktop as well as mobile devices. […]
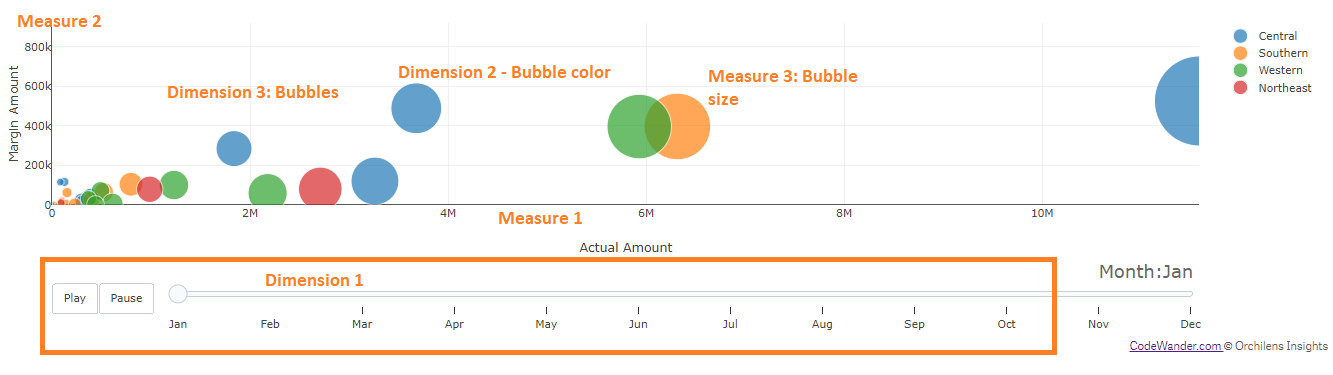
Here is the new qliksense extension – bubble chart animated. This is an inspiration from the animation with sliders example of plotly. This is a […]

I started doing my first angularJS mashup and hence was trying to get an already created angular code. Then I landed upon this angular-gridster example.This […]
Copyright © 2026 | WordPress Theme by MH Themes