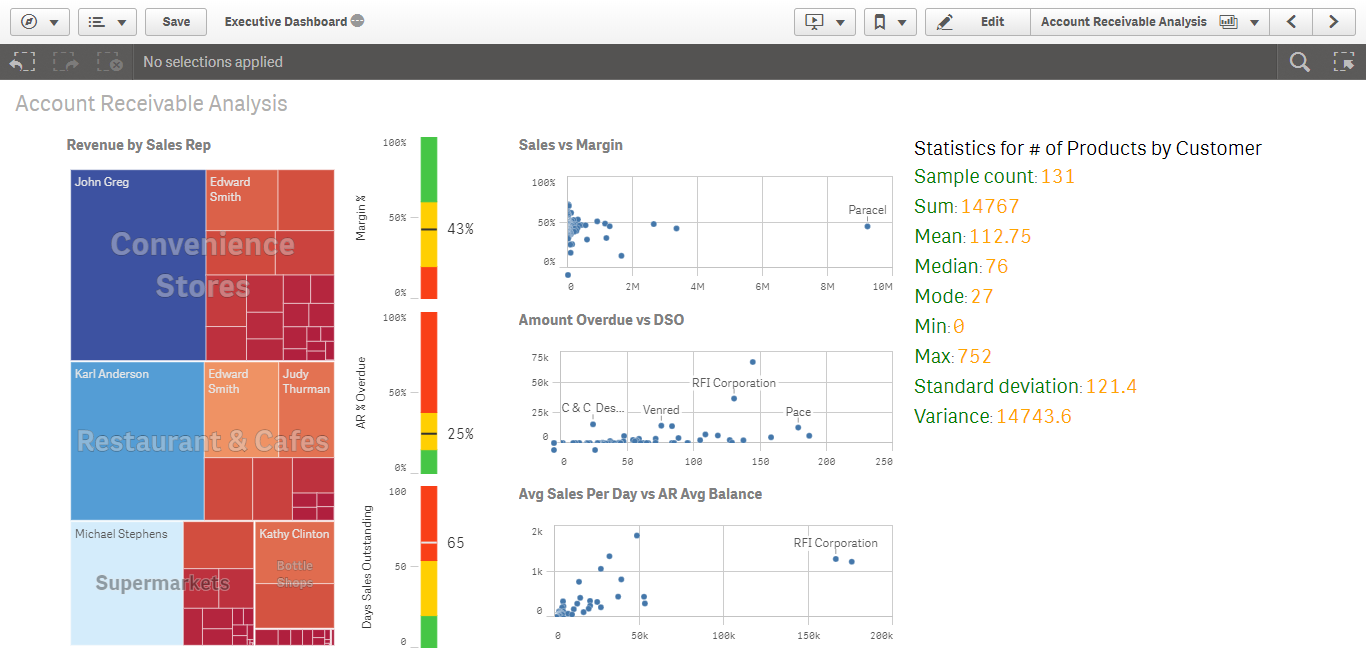
This blog is about the new Qlik sense extension – Statistics Summary. This extension will help getting a quick summary of the statistics for a dimension and measure of interest. This was available in QlikView but not in Qlik sense. Thought KPI can be used to get the necessary metric, it doe not allow the flexibility of showing the summary for the specific dimension but rather for the whole selection.
Download Qlik Sense Extension – Statistics Summary
Approach and options for the Qlik sense extension – statistics summary
The approach is to get the hypercube data and use statistics library to arrive at the basic statistics summary for that subset. This extension treats both numbers and percentages alike.
Measure and Dimension
Currently, you can add only one measure and one dimension. If you want to add more measure, create one summary box for each measure.
Orientation
Currently, the extension lists one item per line. you can make small change to make items orient horizontally.
More Options
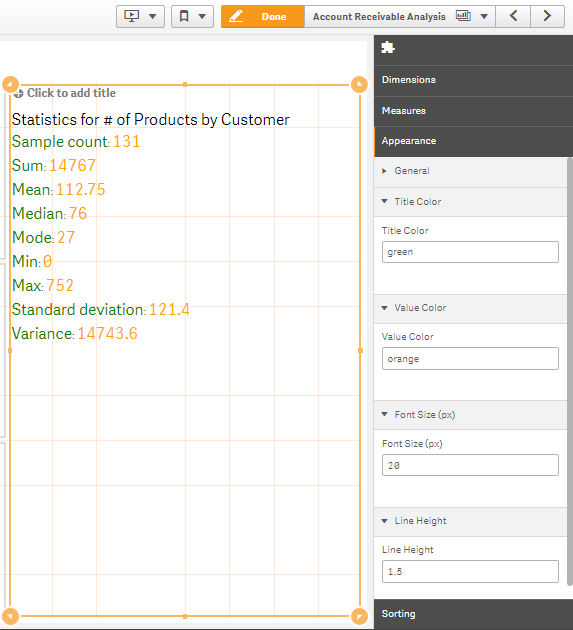
Font Size: Same font size will be applied for the header, title and values. The font size must be entered in pixels.
Title Color and Value Color: Sets the color of the title and value. The header will take the color of the title. The color in hex format must begin with the ‘#’ symbol.
Line Height: This parameter will determine height of each summary item and hence will impact the spacing between the lines. This parameter takes an integer or decimal as input. The unit is the line count and not pixel.
Updated on Julu 11 2018
Fixed NaN error. Added a feature to display items with minimum and maximum values
Updated on June 27 2018
Included section Metric Display option: Now you can choose which metric to display in the summary box.
Updated on June 18 2018
Included option to set item background color and option to set the orientation to either vertical or horizontal.
Demo Video of Qlik sense Extension Statistics Summary


Leave a Reply