Power BI with Opencart
This is the first assignment on Power BI with Opencart. The assignment is to generate a visual analytics platform to find the product performance (Revenue, Margin and Inventory) by category, brand and Pricing.
Though there has been a multiple iterations of the dashboard, it was very easy to make changes on the fly and try out options along with the user in a 3 hour workshop.
What I have embedded here is the live version of one of the early dashboards we developed as the proof of concept to our customer.
Data model design
While the dashboard creation was easier, data binding and creating the association manually was difficult. Due to the long association with Qliksense, it was an additional task to do after designing the various source feeds independently. The manual binding also has lead to some error and revisiting the data model more than once.
Show Data
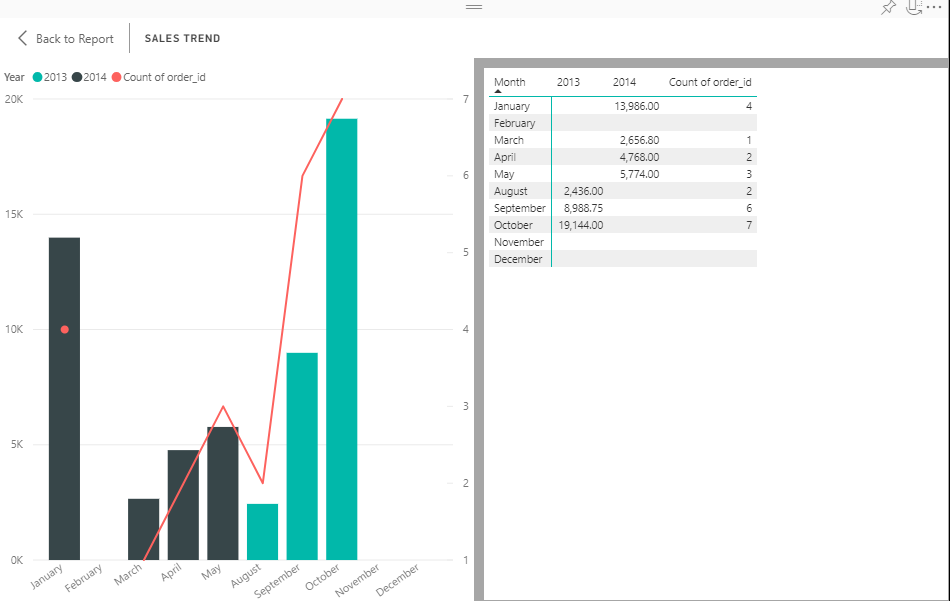
This is a good feature that is there in Qlikview but not in Qliksense. It helps user to see the underlying data without having the need to download.
Drilldown feature
The drilldown on feature has two options that comes in handy during analysis and the user really liked it. It helps them funnel through the first dimension or drilldown to the second dimension without filtering on the first dimension. However, it does not lose the information doing so which is good.
It also has the feature to stop drilling down and all this with very subtle UI elements.
Dashboard Feature
The dashboard feature of Power BI is really good. It helps to summarize the data from different reports to high level. This will help user to get a holistic view of the business while keeping the individual reports relatively small. However, there is no way to apply filters even on the common fields in the dashboard. It would have been an awesome feature.
I will write more about Power BI as we evaluate and use them more going forward, like we do now with Qlik.


Leave a Reply